
Thermo Eberline Facility
Company Name / Public Involvement: Thermo Eberline LLC
License Number: SO067
Date Posted: 7/24/2025
Location: 5981 Airport Road
Santa Fe, NM 87507
Full Thermo Eberline LLC Decommissioning Plan
- Decommissioning Plan Overview & Summary
- Dated 05/28/2025 Submittal Letter Final Decommissioning Plan (PDF)
- Purpose & Scope, Facility Operating History, & Description
- Radiological Status of Facility, Dose Modeling, ALARA Analysis, and Planned Decommissioning Activities
- PM & Organization, Health & Safety During Decomm, Environmental Monitoring & Control
- Radioactive Waste Management, Quality Assurance, & Facility Radiation Surveys
- Financial Assurance
- *Glossary of Acronyms & Abbreviations
- *Supporting Documentation & Attachments
1.0 Purpose & Scope
The following is a detailed description of the Purpose & Scope of the Thermo Eberline LLC Final Decommissioning Plan.
1.1 Overview
In accordance with the requirements of Radioactive Materials License SO067-36, New Mexico Administrative Code (NMAC, 2009) 20.3.3.318.H(1), and NUREG-1757 guidance, this Decommissioning Plan (DP) is submitted to the licensing authority, the New Mexico Environment Department (NMED), Radiation Control Bureau (RCB) by CN Associates, Inc. (CN) on behalf of the Licensee, Thermo Eberline LLC (Licensee or Company) for Radioactive Materials (RAM) License SO067-36 (Appendix A). This DP includes updates to the DP submitted to NMED dated January 31, 2025 in response to NMED review and comment and Licensee responses included in Appendix G.
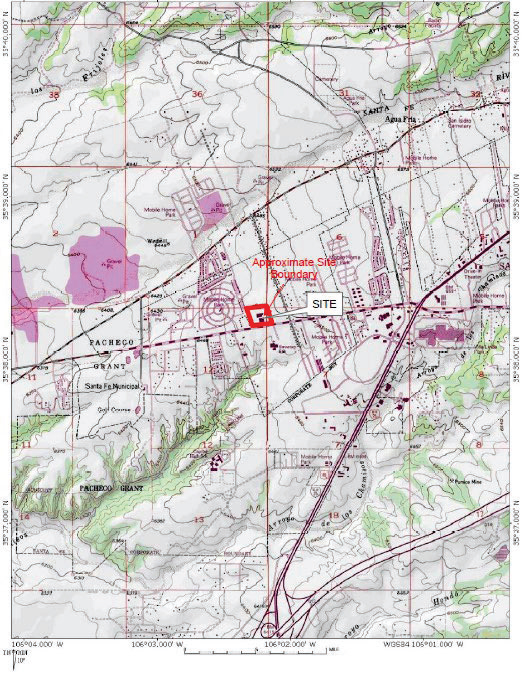
The license was issued December 20, 2022 for the storage of any remaining radioactive materials pending decommissioning of 5981 Airport Road, Santa Fe, New Mexico 87507 (site, Figure 1-1). Site decommissioning work is currently, and will be, conducted by CN, a NMED licensed contractor (License No. RS561-00) on behalf of the Licensee.
Site decommissioning will commence following receipt of NMED approval and a license amendment to add the DP to the license. Site decommissioning will include three phases of work that will be sequenced based on weather, timing and progress to complete the work in a safe and reliable manner:
- Phase 1 includes the demolition and disposition of non-impacted site buildings and contents (excluding foundations). Phase 1 will be the first phase of decommissioning work to be initiated at the site following NMED approval.
- Phase 2 includes demolition and disposition of non-impacted building foundations, concrete, and asphalt surfaces (i.e., Land Surfaces). Soil beneath removed surfaces will be subject to characterization surveys following removal.
- Phase 3 includes removal of a small, impacted portion of the building foundation, adjacent areas of Cesium 137 (Cs-137) impacted soil, and residues of naturally occurring uranium ore in soil. Any other soil impacts discovered beneath foundations, concrete or asphalt surfaces, if present, will also be addressed during Phase 3.
Once all three phases of the site work are complete, wastes are properly packaged and disposed of off-site, and remediation of impacts to background (if feasible) are confirmed, a final survey and testing of site soil and groundwater will be completed under the Final Status Survey (FSS) process under NUREG-1757 to confirm compliance with background, as feasible, or a 15 mrem/yr Total Effective Dose Equivalent (TEDE), if achievement of background is not feasible. Achievement of background or the 15 mrem/yr dose limit will ensure protection during future unrestricted use of the site. A DR summarizing the results of site decommissioning, documenting the results of the FSS and including a request for license termination, will be submitted within 24 months of initiating site decommissioning.
In accordance with the RCB’s rules contained in the New Mexico Administrative Code (NMAC), 20.3.3.318.H(1)(a), this DP is submitted for NMED approval of activities necessary to complete: 1) the demolition and removal of site buildings; 2) the removal of foundations and manmade concrete and asphalt surfaces and surveys to characterize soils beneath those surfaces; and 3) to complete removal of impacted soil, testing of site groundwater and completion of a FSS to confirm that site conditions following restoration meet the license termination criteria of 15 millirem/year established for the site. Under the RCB’s rules, decommissioning actions that have not been routinely applied at the site (such as building demolition and soil removal) and have the potential to impact the health and safety of workers or the public must be outlined in a DP to be approved by the NMED to ensure the protection of workers and the public. NMED approval of this DP will be executed through amendment of License SO067-36 (Appendix A).
Condition 16 of License No. SO067-36 requires the Licensee to “follow Decommissioning Plan in accordance with the provisions of 20.3.3.318.H NMAC, and the United State (US) Nuclear Regulatory Commission (NRC) Guide NUREG 1757 Vol 1, Vol 2 and Vol 3, MARSSIM and MARSAME.” In
accordance with Condition 16, the Licensee coordinated with the NMED in regular meetings to establish the format and content of this DP as necessary to satisfy the requirements stipulated in Condition 16, including:
- Consolidated Decommissioning Guidance, Decommissioning Process for Materials Licenses, Final Report, NUREG-1757, Division of Waste Management & Environmental Protection, Office of Nuclear Materials Safety & Safeguards, US Nuclear Regulatory Commission (NRC). Volume 1, Rev. 2, September 2006, Volume 2, Rev. 2, July
2022 and Volume 3, Rev. 3, February 2012. - Multi-Agency Radiation Survey and Site Investigation Manual (MARSSIM), NUREG-1575 Rev. 1, EPA 402-R-97-016, Rev. 1, DOE/EH-0624 Rev. 1. August 2000.
- Multi-Agency Radiation Survey and Assessment of Materials and Equipment Manual (MARSAME), NUREG-1575 Supp. 1, EPA 402-R- 09-001, Rev. 1, DOE/HS-0004. August 2009.
It is important to recognize that NUREG-1757 guidance was designed to be applied to a broad array of licensees/sites ranging from very simple to very complex. NUREG-1757 was designed to classify facilities undergoing decommissioning into seven (7) groups, based on the amount of residual radioactivity, the location of that material, and the complexity of the activities needed to decommission the site. Group 1 is typical of a sealed source facility that has not experienced any leakage; Group 7 is typical of a large, contaminated facility where decommissioning would result in the license being terminated with restrictions on future site use. These groups were created for convenience of analysis only and are not based on any specific regulatory requirements. Once the decommissioning group is established, elements of the DP follow those outlined for that group according to NUREG-1757.
At the direction of the RCB, this DP is organized to follow the general outline of a Group 4 DP as specified in NUREG-1757. The Group 4 classification is applicable since residual contamination on site is limited to defined locations in subsurface soil, the levels in subsurface soil exceed screening values, cleanup is achievable to meet criteria for future unrestricted use, and groundwater is not impacted by licensed radioactive material at the site. The scope and content of this DP was developed in consultation with the NMED RCB using the Decommission Plan Checklist in Appendix D.1 of NUREG-1757 to establish consensus with NMED on what information should be submitted in the DP for the site based on the uses of radioactive material at the site, the extent and types of radioactive material contamination, the manner in which the Licensee intends to decommission the facility, and other factors affecting the potential for increased risk to the public or workers from site decommissioning. The scope and content of this DP follows the modified acceptance review checklist established between the Licensee and the NMED.
2.0 Facility Operating History
The following describes the Thermo Eberline LLC Facility Operating History as documented in the Thermo Eberline LLC Final Decommissioning Plan.
2.1 License Number / Status / Authorized Activities
2.1.1 Radionuclides, Forms & Maximum Activities Authorized & Used Under the Current License
The radionuclides, forms and maximum quantity (as the activity limit that may be possessed at any one time) are summarized below in Table 2-1 as listed in Attachment 1- Radioactive Material Specifications for License No. SO067-36 (Appendix A).
TABLE 2-1: Currently Licensed Radionuclides, Forms & Maximum Quantities (pdf)
| License Item 6 | Radioactive Materials (element & mass number) | Form (chemical or physical) | Maximum Quantity (Licensee may possess at any one time) |
| A. | Any radioactive materials between atomic numbers 84 and 95 inclusive. | Any. | 1 millicurie per radionuclid, not to exceed 12 millicurie, total. |
| B. | Cesium 137. | Any, other than sealed sources. | 12.6 curies, total. |
| C. | Any radioactive materials between atomic number 1 and 83 inclusive. | Any. | Not to exceed 1 millicurie per radionuclide, 20 millicuries total. |
| D. | Any radioactive material with atomic number greater than 95. | Any. | 1 millicurie, total. |
| E. | Depleted Uranium. | Any. | 1 millicurie, total. |
| F. | Americium 241. | Any. | 861.6 millicuries, total. |
| G. | Carbon 14. | Any. | 8 millicuries, total. |
| H. | Plutonium 239. | Any. | 3.1 millicuries (50mg), total. |
| I. | Plutonium 239/Beryllium. | Any. | 50 microcuries, total. |
| J. | Plutonium 239/Lithium. | Any. | 133.5 millicuries, total. |
| K. | Thorium 230. | Any. | 3 mircocuries. |
2.1.2 Current Radionuclide Use & Storage
Under License Condition 9, Authorized Uses include:
- Items A. and B. Storage Only. For handling of licensed material for disposal.
- Items C. through K. As a contingency if radioactive material was discovered during the scoping survey and sampling process of previously licensed materials.
There is no current use of licensed radionuclides at the site under this license. The use of licensed radionuclides at the site ceased when principal manufacturing operations at the site were discontinued in June 2007. The process of removing all licensed radioactive material, sending the materials to other licensed facilities for productive use, or to licensed disposal sites began in 2007 and was largely completed by 2016. The only licensed radionuclides remaining at the site that require cleanup are residual impacts to soil from a past release of Cs-137 formerly located within the High Range Calibration Well (HRW) located in the former Calibration Source Room and residues of naturally occurring uranium ore in soil at locations G95 and G140 (Figure 2-1).
2.1.3 Amendments to License SO067-36 Since Renewal in December 2022
No amendments to License SO067-36 have been made since renewal on December 20, 2022.
2.2 License History
2.2.1 Radionuclides, Forms & Maximum Activities Authorized & Used Under All Previous Licenses
Radionuclides, forms, maximum activities authorized, used under all previous licenses, and ultimately dispositioned by the Licensee as part of the site decommissioning process are summarized in Appendix B, Thermo Eberline LLC, Inventory Report.
The Inventory Report in Appendix B utilized License No. CS067-25 (Amendment 25) (TE, 2006), because it was the license in effect when: 1) the Licensee ceased principal manufacturing operations and initiated transition into the decommissioning process; 2) NMED issued a Settlement Agreement and Stipulated Final Order RCB 07-015 (August 7, 2007) (NMED, 2007a&b), affirming the Licensee’s records of receipt and transfer of all radioactive materials were satisfactory.
Amendments subsequent to No. 25 removed line items from the license but did not add any additional items or were administrative amendments.
2.2.2 Radionuclide Use & Storage
The radioactive sources and materials used were of several types including (CN, 2022c):
- millicurie to curie quantity encapsulated (i.e., sealed) sources stored in the deep shielded “wells”;
- “stick” or low-level photon sources mainly using Cs-137 or Cobalt- 60 (Co-60) radionuclides;
- electroplated alpha or beta-gamma sources and metallic uranium sources used for precise beta emission rates; and
- uranium and thorium in oxide forms
The radiation sources and radioactive materials were used to:
- determine the minimum detectable activity (MDA) or concentration that a given radiation detection system could measure;
- check for the proper radiation response of an instrument or system over time; and /or
- calibrate or recalibrate a radiation detector or system for linearity, precision, or accuracy
Calibration sources were generally in sealed form, except for sources that were used historically for calibration of liquid or gas monitoring instruments.
Two exceptions to the normal use of radioactive material described above are as follows. First, approximately 8.6 Curies (Ci) of unsealed Americium 241 (Am-241) was licensed for storage only pending disposal under line MM on License CS067-25:
“For storage in 7 each 2R containers with each container located in a 6M Type B container pending disposal.”
The Am-241 described above was never used at the site but was transferred from the Eberline facility in Albuquerque for storage. The Am-241 was stored in multiple encapsulated steel containers located within a High Integrity Polyethylene Container (HIC) from November of 2000 until February of 2016. The material was transferred to Los Alamos National Security, LLC (LANS) for recovery and disposal on February 21, 2016 (CN, 2022c).
Second, in November 2007, a Cs-137 sealed source was discovered to be breached at the bottom of the HRW during the planned removal of sources from the calibration wells for disposal (CN, 2022c).
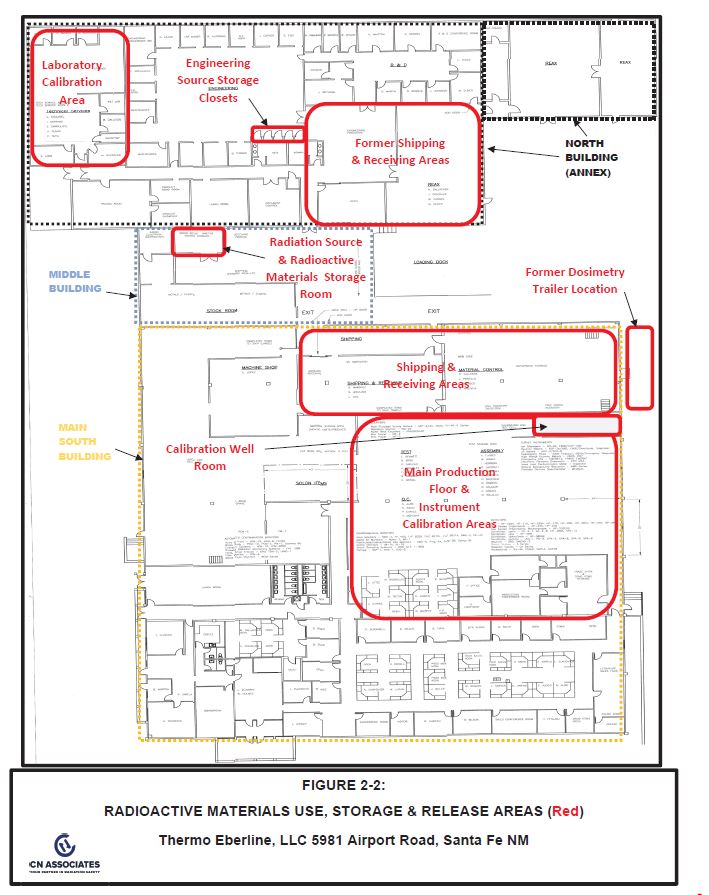
Locations within the facility where facility employees indicated radioactive materials were used, stored and/or released based on employee interviews (CN, 2022c) are listed below by building and shown on Figure 2-2.
- Laboratory and Calibration Areas (North Building)
- Engineering Source Storage Closets (North Building)
- Radiation Source Storage Room (Middle Building)
- Shipping and Receiving Areas (North and South Buildings)
- Dosimetry Trailer (Adjacent to East Side of South Building)
- Customer Service Areas/Production Floor (South Building)
- Calibration Well Room (South Building)
2.3 Previous Decommissioning Activities
2.3.1 Spills, Burials & Remedial Areas
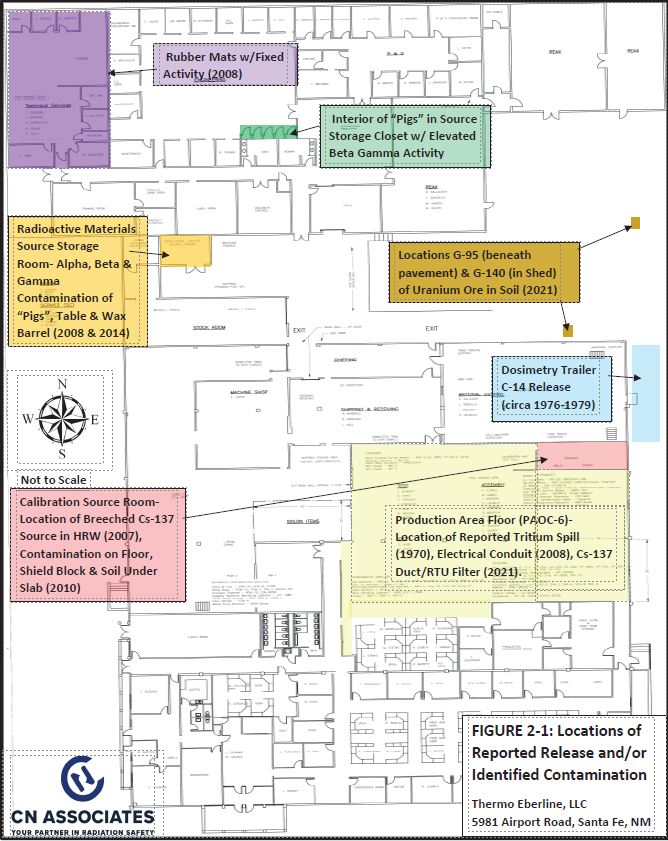
Areas of the site where spills, burials and/or releases of licensed radioactive materials occurred and were remediated are summarized in Figure 2-1. The following sections summarize the types, forms, activities and concentrations of radionuclides released, if known, the cause of the release, if known, the remedial measures implemented, remedial waste dispositioned, and results of the final radiological evaluation for each of the remedial areas.
All identified impacts from licensed radioactive materials presented in this section have been addressed and wastes properly disposed of off-site with the exception of residual soil impacts from Cs-137 at the former HRW and residues of naturally occurring uranium in soil at locations G95 and G140 (Figure 2-1). Additional details are summarized in documents referenced in the Final Historic Site Assessment Report (HSA) (CN, 2022c).
2.3.2 Tritium (H-3) Spill on Production Floor November 13, 1970
An interoffice memorandum dated November 13, 1970 indicated two small vials containing approximately 1 microcurie (uCi) of tritium (H-3) were broken on the production floor (Eberline, 1970). The spill was reportedly cleaned up immediately and waste materials properly disposed.
Wipe samples collected after cleanup indicated less than 3E-05 uCi on the floor. Urine samples of the employees involved in the incident also indicated less than 3E-05 microcurie per milliliter (uCi/ml) in urine. The former production area (Figure 2-2) was subject to survey and sampling during characterization of the building and indicated that the levels of residual tritium contamination detected were below applicable NMED RCB Release Criteria (NMED, 2019 & CN, 2022b).
2.3.3 Carbon 14 (C-14) Spill in Dosimetry Trailer 1976 to 1979
Interviews with employees (see HSA, CN, 2022c) indicated a spill of C-14 in the dosimetry trailer located along the east side of the South Building (Figure 2-2). The date of the incident is unknown but reportedly occurred between 1976 and 1979. The quantity of C-14 released is unknown.
Typically, the use of C-14 associated with dosimetry included minor quantities. The license active in 1977 (License Number NM-EBE-BL-00) indicated that the Eberline Albuquerque and Santa Fe facilities were authorized for a combined limit of 20 millicuries (mCi) of C-14. The spill was reported and cleaned up, but employees indicated that C-14 could have been tracked outside the trailers and into the South Building. The trailers were removed at an unknown date.
Characterization of the building and ground surfaces in and around the former location of the trailers by CN indicated no evidence of residual C-14 above background on building surfaces or in soil (CN, 2022c).
2.3.4 Cesium 137 (Cs-137) Breached Source in the High Range Calibration Well (HRW) 2007-2017
Loose Cs-137 contamination was discovered by the Licensee in August 2007 during the unloading of sealed sources stored within calibration wells (Figure 2-2). Subsequent evaluations indicated a source had fallen to the bottom of the HRW and removable contamination was found in the well (TE, 2008). The source that had fallen to the bottom of the HRW was then suspected, and later confirmed by CN, to have been a 16 Ci Cs-137 source.
The breeched source was encapsulated in concrete in the bottom of the HRW, recovered during removal of the well in 2010 and shipped to a licensed off-site disposal facility (ERM, 2011). Upon removal, the steel well casing was found to be corroded with a breech in the casing at an estimated 12 feet below ground surface (bgs). Cs-137 was found in soil adjacent to the well at a concentration of 1,220 picocuries per gram (pCi/g) (ERM, 2011).
In 2012, removal of an estimated 11.8 cubic yards (cyds) of Cs-137 contaminated soil was completed by a combination of shallow excavation to eight feet and auguring within the footprint of the former HRW to a depth of 24 feet below grade (TIG, 2013). The Cs-137 impacted soil removed was shipped to a licensed off-site disposal facility. Sampling following removal indicated residual concentrations of Cs-137 remaining in soil up to 7,960 pCi/g.
In 2017, a detailed characterization program was implemented including the advancement of 30 soil borings within a 6×6 foot area surrounding the former HRW. Continuous soil cores and sampling were completed to define the remaining extent of residual Cs-137 impact in soil (Appendix D).
Residual impacts were defined to extend from the center of the former HRW outward and to be contained within an area estimated at four feet in width in the east-west direction and five feet in length in the north-south direction. The vertical extent of impact was estimated to extend from six to 24 feet bgs. The total volume of residual soil impact remaining in place was conservatively estimated at just under 20 cyds (CN, 2017). This area has been covered, posted, regularly inspected, and access restricted pending remediation during decommissioning.
2.3.5 Areas of Isolated Impacts – 2008 Scoping Surveys
Dade Moeller & Associates (DMA) completed scoping surveys of the facility walls, floors, workspaces, materials and equipment and reported the following five (5) locations (Figures 2-1 and 2-2) of isolated radioactive contamination that were decontaminated, contained for disposal, or contained and labeled for future abatement (DMA, 2008), including:
- Source Well Calibration Room- Loose gamma activity was identified at two locations on well shield blocks and cleaned to background. Loose gamma activity associated with Cs-137 was found on the floor near the HRW, sealed with tape and subsequently removed and disposed. Elevated activity was identified within the HRW based on dose surveys over the top well opening.
- Production Floor- A section of electrical conduit that had reportedly been used to probe the HRW was identified adjacent to the Source Well Room exhibited elevated gamma activity associated with Cs-137 The conduit was wrapped in tape and disposed of off-site.
- Radioactive Materials Storage Room- Elevated beta/gamma activity were identified on the exterior of two source storage containers (pigs) and contained for disposal. One table surface and a plastic bottle of white powder were found to be contaminated with alpha activity and disposed of off-site. The top of one wax barrel (typically used to store neutron sources) was found to exhibit removable gamma activity and disposed of off-site.
- Radioactive Source Closet- Elevated beta/gamma activity was identified on the interior of two pigs that were contained and disposed of off-site.
- Engineering Annex- Rubber mats were found to contain elevated fixed activity and were bagged and subsequently disposed of off- site.
The locations of elevated activity were addressed by DMA and/or the Company by decontamination and/or containment for disposal.
Two exceptions included: 1) the Cs-137 contamination on the floor of the Source Well Calibration Room which was contained with tape and labeled for control and future abatement; and 2) elevated activity within the HRW (DMA, 2008).
The elevated activity on the floor under tape was addressed by the Company Radiation Safety Officer (RSO) prior to calibration well removal in 2010. The elevated activity within the HRW was addressed during the HRW removal in 2010 (ERM, 2011).
2.3.6 Uranium Ore in Soil 2020-2021
In late 2020, CN completed a series of radiation surveys and testing of exterior ground surfaces (soil, asphalt and concrete) over all accessible exterior areas of the site (CN, 2021a). The site was divided into 10 survey areas, six adjacent to the buildings and four along the boundaries of the site (Figure 13-1).
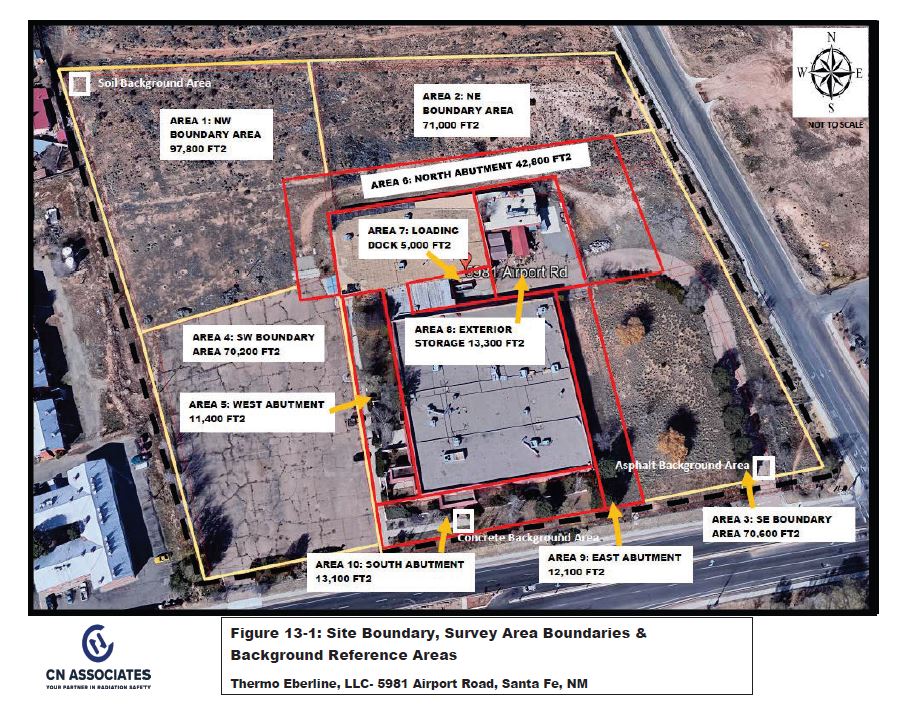
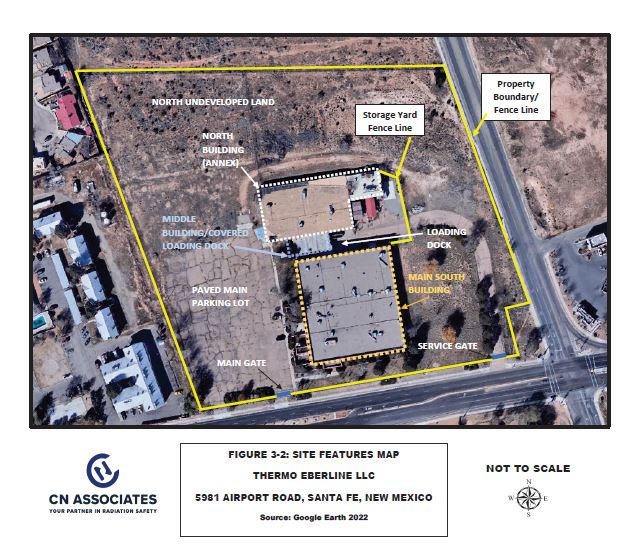
Elevated radioactivity from ground surface surveys was confirmed at only two locations (G95 and G140) in Survey Area 8, the Exterior Storage Area located to the east of the Middle Building/Loading Dock (Figure 3-2).
Location G95 correlates with a crack in the asphalt in Survey Area 8. Location G140 was located within an unpaved area inside of a shed located along the north wall of the South Building.
Further evaluation of G95 and G140 was completed by manual removal of asphalt, soil excavation, soil screening and collection of samples for laboratory analysis. The asphalt removed at location G95 did not indicate activity above reference background. However, total gamma readings of excavated soil beneath the asphalt crack at G95 were up to 37,000 counts per minute (cpm). Pieces of black rock fragments in soil beneath the pavement with green and yellow discolorations (characteristic of naturally occurring uranium ore) indicated gamma activity up to 850,000 cpm on contact using a using a 3”x3” Sodium Iodide Detector (NaI(Tl)).
Similarly, soil excavated from an estimated six inches below the ground surface at G140 exhibited total gamma readings up to 425,000 cpm. Larger pieces of angular black rock fragments with green and yellow discolorations indicated total gamma readings up to 616,000 cpm using a 3”x3” NaI(Tl) or 3 milli-Roentgen per hour (mR/hr) on contact using a Ludlum Model 19 (micro-R meter).
Excavations were advanced at both G95 and G140 extending an estimated 2×2 feet in width and 1.5 feet in depth. An estimated 10.5 cubic feet (ft3) of impacted soil was removed, contained, and shipped to a licensed off-site disposal facility. Soil samples collected from the floor and four walls (north, south, east, and west sides) of each excavation were screened and found to exhibit gamma activity approaching, but distinguishable from, reference background (24,000 cpm). Samples of the angular black rock fragments with green and yellow discolorations and post-excavation soil samples from the walls and floor of the excavations at G95 and G140 were submitted for laboratory analysis of target licensed radionuclides.
Results of laboratory analyses of the angular black rock fragments with green and yellow discolorations and post excavation soil samples indicated the presence of uranium isotopes similar in composition to naturally occurring uranium ore. Removal of the ore reduced the level of impact to soil, however, residues of naturally occurring uranium isotopes U-233/234 and U-238 remain in soil at concentrations up to 43 pCi/g (above NMED Volumetric Release Criteria of 7.8/8.4 pCi/g, respectively). These areas have been covered, posted, and routinely inspected to ensure access is restricted pending remediation during decommissioning.
3.0 Facility Description
The following is a detailed description of the the Thermo Eberline LLC Facility as documented in the Thermo Eberline LLC Final Decommissioning Plan.
3.1 Site Location, Description, and Land Use
The licensed facility is located at 5981 Airport Road, Santa Fe, in Santa Fe County, northern New Mexico. The location of the property is shown on the United States Geologic Survey (USGS, 2022) 7.5 Minute Topographic Quadrangle Map (Figure 1-1). The site, situated between the Sangre de Cristo Mountains to the east and the Rio Grande to the west, occupies approximately 11.4 acres in topographic Section 12 of T16N, R8E (latitude 35.6369 north, longitude 106.037 west) at an elevation of 6,497 feet above mean sea level (msl). Figure 1-1 illustrates the site location, local setting, and shows the regional topography around the site gently sloping from east to west at a gradient of approximately 0.01 feet/foot (USGS, 2022).
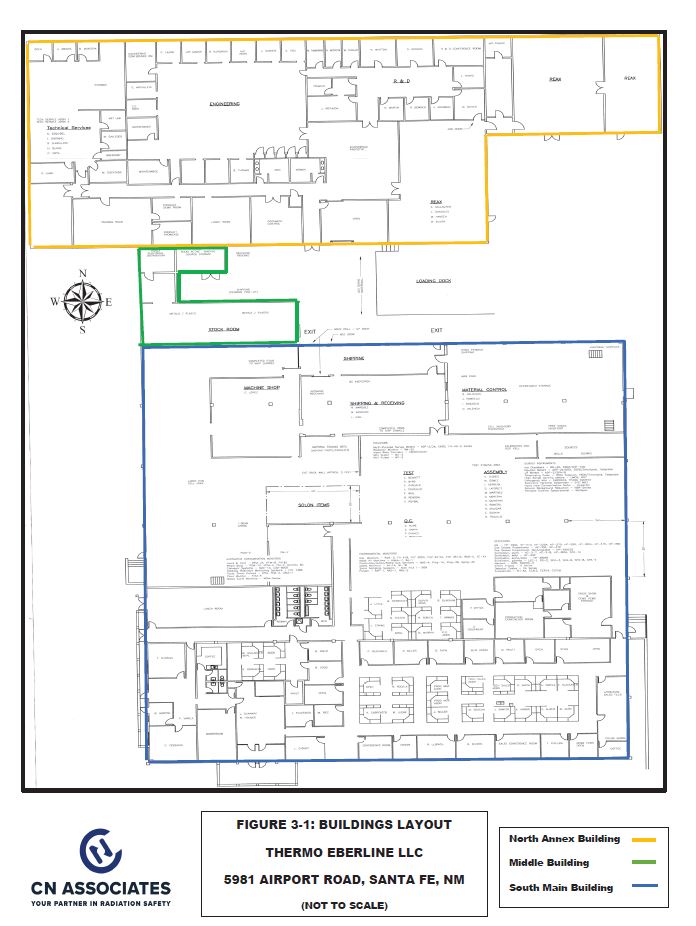
The site is occupied by a complex of three buildings (Figure 3-1):
- The Main South Building is 41,600 sft and was constructed by Eberline in 1968.
- The North Building, or Engineering Annex, is 25,000 sft and was added on to the northern end of the South Building in 1978.
- The north and south buildings are connected by a covered loading dock and adjacent storage rooms that comprise the Middle Building also added in 1978.
The structures consist of concrete slabs on grade with cinder block wall construction, with either brick facing or cement plaster on the exterior and painted or dry-wall construction on the interior. The roof of the North and South Buildings is constructed of pre-cast concrete sections supported by steel I-beams with an angled tile canopy around the perimeter of the building. The roof of the Middle Building and northeast portion of the North Building are constructed of corrugated metal on steel cross bracing (CN, 2022c).
Utilities servicing the facility include electric, natural gas for heat and cooling, and City of Santa Fe water and sewer. These utilities were connected at the time of construction. Utilities (gas, water and electricity) have been taken out of service and temporary electrical service provided on a separate line during the assessment, clean-up, and for site decommissioning.
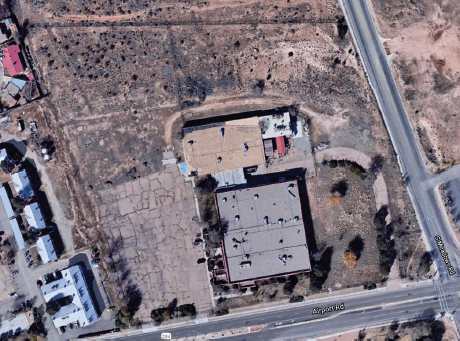
The immediate area surrounding the buildings is landscaped or paved with asphalt or covered with concrete including the main parking lot and a storage yard within a fenced area to the east of the loading dock (Figure 3- 2). The rear north half of the property remains undeveloped with a dirt drive wrapping around the north end of the North Building.
The entire site is surrounded by a chain-link fence and is accessed by two paved driveways along the southern boundary off of Airport Road (Figure 3-2). All gates are locked and include:
- The main gate along Airport Road leads to the main parking lot on the west side of the South Building.
- One driveway extends from the service gate north and turns west to the loading dock and fenced storage area on the east side of the South Building.
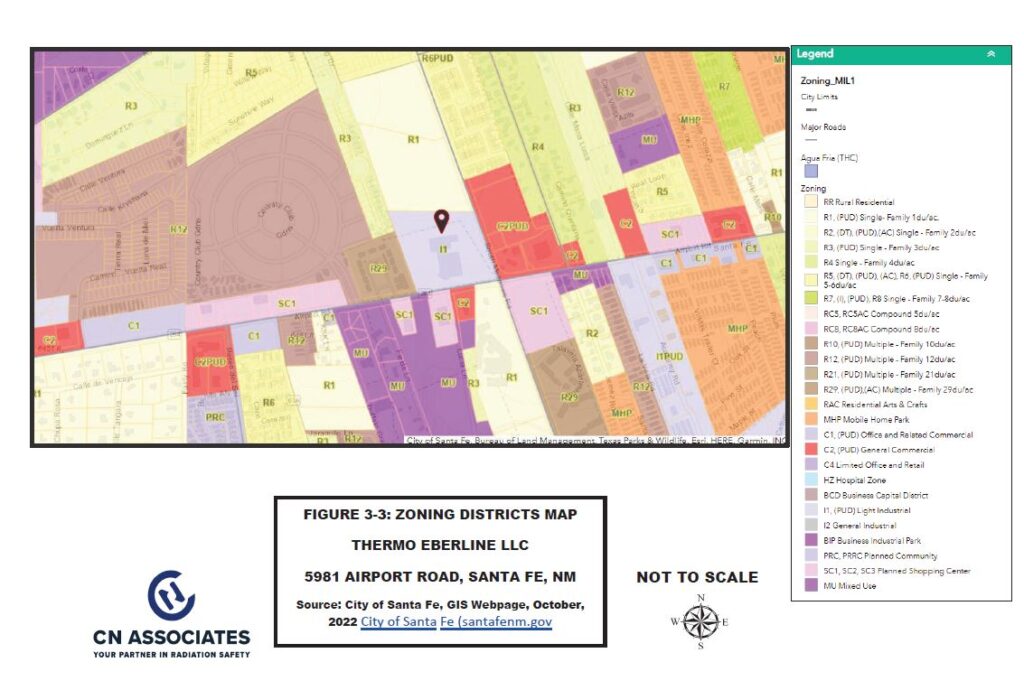
The site is located within the Santa Fe City Limits and is currently zoned as light industrial by the City of Santa Fe (Figure 3-3). The surrounding properties (Figure 3-4) are zoned residential with mixed commercial (City of Santa Fe, 2022), and include:
- Vacant land abuts the north boundary, recently re-zoned to allow development and construction of residential dwellings and a park (Homewise Los Prados development).
- South Meadows Road abuts the property to the east, beyond which is a commercially zoned property developed with a gas station. Land along South Meadows Road includes a vacant lot and residential properties.
- Airport Road abuts the property to the south, across which lie commercial and residential properties and a school (Sweeney Elementary School).
- Single and multi-family residential dwellings abut the property to the west (Country Club Apartments/Country Club Gardens).
There are no surface waters on site. Surface waters in the area surrounding the site include:
- The Santa Fe River, approximately 0.75 miles north.
- An intermittent drainage approximately 0.4 miles south and southwest of the site that feeds the Arroyo de Los Chamisos.
- The Rio Grande is located approximately 16 miles west.
- Cochiti Reservoir is located on the Rio Grande approximately 16 miles to the west and maintains a permanent pool of 50,000 acre-feet.
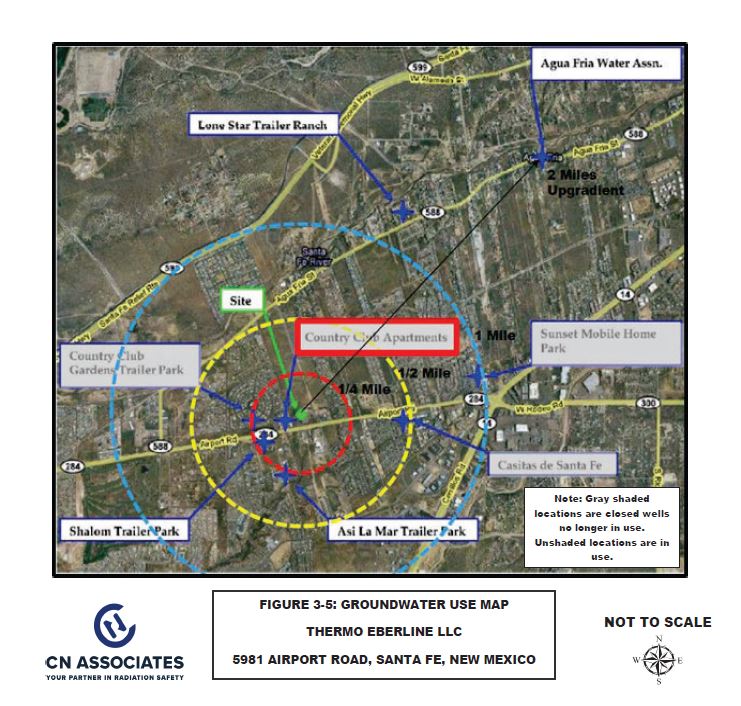
The Tesuque Formation is located beneath the site and is the most significant water-bearing formation and the primary aquifer (source of potable drinking water) for the City of Santa Fe (Lazarus and Drakos, 1995). The depth of groundwater beneath the site is approximately 331 to 336 feet within the Tesuque Formation (DBS&A, 2025).
Figure 3-5 shows the location of the site, the estimated ¼, ½ and one-mile radius from the site and the location of domestic water supply wells identified within two miles of the site based on a review of the well records of the New Mexico Office of the State Engineer’s (NMOSE). The closest supply well identified near the site was on the adjacent Country Club Apartments property abutting the site to the west. The gray shading of the labels in Figure 3-5 designates that the NMOSE records indicated the well was inactive, closed and/or no longer in use. The unshaded locations designate that the well was listed as still active (CN, 2022c).
3.2 Population Distribution
The City of Santa Fe has a population of 93,373 (according to the worldpopulationreview.com, February 2023) and is growing at a rate of 2.14 percent annually. The Census Reporter reports the following demographics for Census Block Group 35049.1205.1 within which the site is located:
The population is reported at 3,711 of which:
- The median age is 27 years.
- 51.4% is female 48.6% is male.
- 86.8% is Hispanic, 12.3% is White, 0.6% is Black and 0.3% in American Indian.
- 17.5 % of residents report income below the poverty level.
- Total households are reported at 1,030 with 78.3% of households are families and 21.7% are non-family
3.3 Meteorology & Climatology
3.3.1 Overview
Meteorology is the science of atmospheric climate and weather. Meteorological characteristics of the site area can be important to the consideration of migration of potential radiological contaminants in the environment.
Santa Fe is located in the northern Rio Grande Valley of New Mexico, situated in the foothills of the Sangre de Cristo Mountain range. New Mexico in general has a mild, arid or semiarid, continental climate with associated characteristics of low precipitation totals, significant sunshine, low relative humidity, and a relatively large temperature range (annually and daily).
Meteorological data were derived primarily from the websites of the Western Regional Climate Center (WRCC, 2022) and the New Mexico Climate Center (NMCC, 2022).
Specific data were derived from weather stations in proximity to site, including the broadcast station KSAF weather station at the Santa Fe County Airport (approximately 2.5 miles west-southwest of the site), a weather station at the Santa Fe Police Academy (approximately 0.84 miles to the southeast), and the Santa Fe 2 Weather Station (approximately four miles northeast of the site).
3.3.2 Wind
Based on data collected between 1996 and 2006 at the KSAF weather station, the annual average wind speed is 9.5 miles per hour with the highest winds occurring during the months of April and May (NMCC, 2022). Prevailing wind direction, measured hourly at the KSAF station from 1992 to 2002, is from the north.
3.3.3 Temperature
Climatological data were derived in the form of climate normals prepared by the National Climatic Data Center (NCDC) and evaluated from the WRCC website for the Santa Fe 2 Weather Station (WRCC, 2022). The normals are based on data collected between 1971 and 2000. The annual mean temperature at the weather station is 49.4° Fahrenheit (F) with a monthly mean range from 29.3°F in January to 69.8°F in July. The mean temperature ranges from 34.2 to 64.7°F on an annual basis.
3.3.4 Precipitation
Precipitation in the area is predominantly from brief thunderstorms during the months of July and August that account for approximately 30 to 40 percent of the annual total rainfall. This is supplemented by frontal events throughout the year linked in general to Pacific Ocean storm movement across the continent.
Data from the Santa Fe 2 Weather Station NCDC show that total precipitation averages 14.22 inches per year (WRCC, 2022). The lowest mean monthly precipitation (0.5 inches) occurs in February and the highest mean monthly precipitation (2.25 inches) is recorded in July (WRCC, 2022). Despite the mean normal values, it is not uncommon for a month to pass without any precipitation in the arid climate of Santa Fe.
An annual average snowfall of 19.4 inches was recorded for the Santa Fe 2 Weather Station between 1972 and 2007, with the highest averages measured in December (WRCC, 2022). Despite the positive average snowfall reported for all months from October to April, accumulation is limited and only January has a positive value for average snow depth.
The site lies outside the 100-year floodplain of the Santa Fe River (FEMA, 2022). Surface drainage at the site is to the west and south based on observed site topography and the topographic map provided as Figure 1-1.
3.3.5 Relative Humidity
Relative humidity information is presented for various New Mexico locations for both morning and afternoon by the WRCC. Although the data set does not include Santa Fe-specific stations, the relative humidity data for the City of Albuquerque (further south in the Rio Grande Valley) is considered conservatively high due to the lower elevation of Albuquerque.
The WRCC data show annual average relative humidity levels at 60 percent and 29 percent for the morning and afternoon time frames, respectively (WRCC, 2022). The lowest humidity measurements were recorded during the months of December and January while the maximum values occur during May and June.
3.3.6 Evapotranspiration
As would be expected in an arid climate, evapotranspiration occurs at quite high rates. Pan evaporation data measured from 1972 to 2005 for the Santa Fe 2 Weather Station show an average annual evaporation of 60.22 inches (WRCC, 2022). No net evaporation is reported for the months of November through March. The highest monthly average is 11.31 inches in June (WRCC, 2022).
3.4 Geology & Seismology
3.4.1 Overview
This section provides a summary of the site geology and seismology based on literature and site-specific information available in reports regarding geologic deposits encountered in soil borings advanced on the site. Geological information assists in defining the horizontal and vertical extent of potential subsurface radiological contamination, as well as the potential transport of contaminants to surface water or groundwater.
3.4.2 Regional Geology
The primary physical feature describing the geology of the Santa Fe area is the Rio Grande Rift. The rift is an elongated series of north/south valleys that were formed as a result of the underlying earth’s crust spreading apart. The crustal spreading created a series of basins that extend from Colorado to Mexico.
The primary basin in the Santa Fe area is the Española Basin which is about 50 miles long and 18 to 40 miles wide, bounded to the north by the Santa Fe uplands and San Luis Basin, to the east by the Santa Fe and Sangre de Cristo Mountains, to the southwest by the Santo Domingo Basin and to the west by the Jemez Mountains (Land, 2016). The Española Basin is geologically complex and further divided into several sub-basins (Figure 3-6).
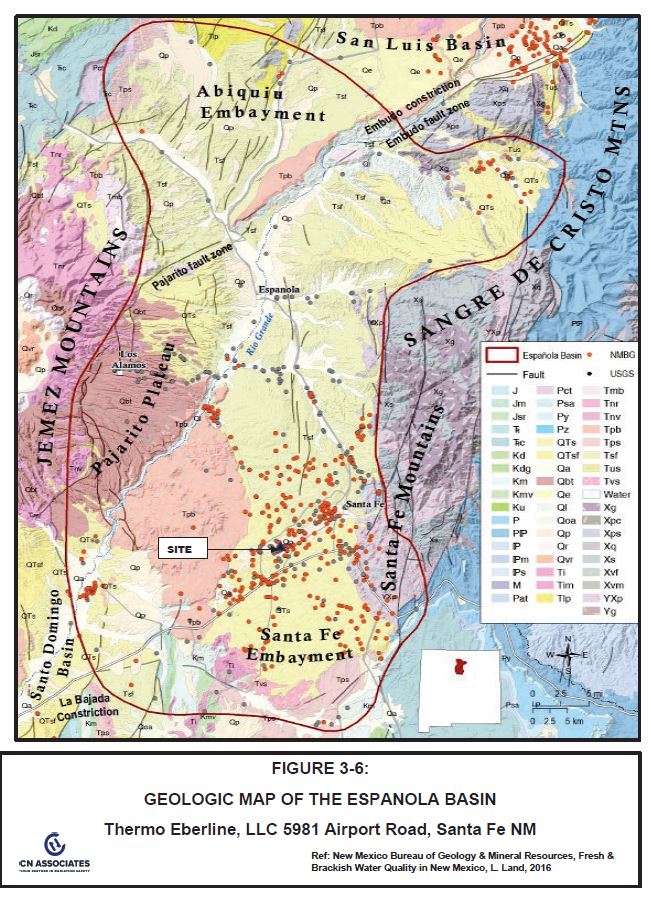
The Española Basin has been filled with sediments from erosional and depositional process occurring over millions of years, including fluvial (sediment deposited by rivers and streams); eolian (sediment deposited by wind); alluvial and colluvial (sediment deposited on mountain front slopes); lacustrine (sediment deposited in lakes); and volcanic (molten rock and ash from eruptions).
The sequences of these sedimentary deposits in the Española Basin have been categorized as belonging to the Santa Fe Group (Bartolino & Cole, 2002). The Santa Fe Group thickens from 250 feet south of Santa Fe to over 10,000 feet to the northwest. The basement granitic rocks of the Sangre de Cristo Mountains underlie the Santa Fe Group to the east, while limestone and volcanic rocks underlie the Santa Fe Group to the west (Land, 2016).
The Santa Fe Group geologic units include sediments and volcanic rocks deposited in the Rio Grande Rift, and like the rift valley, these sediments extend north to south through the central area of New Mexico. Lithology (rock type) consists primarily of siliciclastic sediments and volcanic rocks. The deposits within the upper portion of the Santa Fe Group are defined as the Ancha Formation and are comprised of granite-bearing gravel, sand and mud from the southwestern flank of the Sangre de Cristo Mountains (Koning, et. al, 2002). These strata are estimated to be less than 150 feet thick and comprise a locally important aquifer for private domestic water supply wells south of Santa Fe, but not in the area of the site. The Ancha Formation is underlain by the Tesuque Formation composed of a pinkish-tan silty sandstone with minor conglomerate and siltstone that are exposed to the north of the basin in the Santa Fe uplands. The Tesuque Formation is the primary water supply for the City of Santa Fe.
In the Santa Fe area near the site, the siliciclastic sediments are primarily comprised of eroded sediments derived from granitic and sedimentary rock sources in the Sangre de Cristo Mountains to the east. During the lower Oligocene to upper Pleistocene geologic periods (about 2 to 30 million years before present), the sediments were deposited in fluvial and alluvial depositional environments by the ancestral Santa Fe River system that flowed from the Sangre de Cristo Mountains to the ancestral Rio Grande (Koning and Read, 2010). Deposition occurred across a large drainage area leaving interbedded deposits of sand, silt, and clay.
The ancestral Santa Fe River created an alluvial fan along the mountain front with a series of stream channels that erode channels into existing sediments, depositing sediment within the channels. During periods of high stream flow, water would spill out of the river channels onto the flood plain. The suspended load of sediment would be deposited as overbank deposits, which are typically fine-grained and composed of mostly clay-size material. Some lakes and ponds also occurred in the area, and the lacustrine deposits associated with these features can be extensive. For example, Koning and Read (2010) document a 500-foot-thick clay-dominated sequence near Santa Fe Airport.
Around Santa Fe, the Tesuque Formation represents most of the basin-fill sediments of the Santa Fe Group consisting of silty-clayey sand and sand with lesser amounts of gravel, silt and clay (Spiegel and Baldwin, 1963; Johnson and others, 2016). The formation is consolidated and typically weakly to moderately cemented. The formation is divided into “lithosomes” that are defined based on similar lithology and depositional environments. The channel and floodplain deposits of the ancestral Santa Fe River system are known as lithosomes of the Tesuque Formation (Koning and Read, 2010).
Lithosome S is recognized by its typical “reddish color (particularly compared to the browner, distal alluvial slope facies of Lithosome A), and high-energy-flow deposits in very broad, thick channel complexes that possess very thin to medium, planar to lenticular internal bedding (Koning and Read, 2010).” The sediments are arkosic sands with granitic material being the most common.
Based on descriptions from Koning and Read (pages 21 to 23, 2010), the lithology of Lithosome S exhibits the following characteristics for channel and floodplain deposits:
- The channel sands are fine- to coarse-grained and commonly light brown. The channel units are typically connected, and the grain-size distribution tends to fine-upwards.
- The floodplain deposits include overbank and tributary channel deposits.
- Mudstone: Mudstone amounts vary and when present are reddish brown, yellowish red, and light reddish brown sandy mudstone. Locally clay deposits reflect floodplain and some lake or pond deposition.
- Sand and sandstone: The overbank sediments consist of light brown, reddish yellow, pink, and very pale brown siltstone, very fine- to coarse-grained (generally fine-grained) sandstone, and silty to clayey sandstone.
- Sand and sandstone: Tributary units occur within the fine sediment and are typically fine- to coarse-grained sands in very thin to medium, lenticular channel-fills with individual beds up to 1 meter thick.
Geologic structures in the area include a regional fold and fault system. The Santa Fe Embayment is a large syncline that strikes north to south and extends from the Sangre de Cristo Mountains to the Cerrillos uplift; the Site lies on the eastern limb of the syncline. A series of faults, known as the Agua Fria Fault System, strike north to south and have displaced and tilted geologic units along the synclinal limbs.
3.4.3 Site Geology
The site geology is described below based on the results of several subsurface investigations involving the advancement of soil borings completed between 2009 and 2024 to depths of 365 feet bgs.
Soil boings were advanced on the site in 2009 beneath the South Main Building around the former calibration wells to a depth of approximately 40 feet bgs (ERM, 2009b). The subsurface deposits encountered in those borings were described to consist of the following sequence of unconsolidated deposits:
- Sand and silty, clayey sand, generally present from 0 – 24 feet bgs.
- Clay up to 4 and 4.5 feet thick, generally present around 24 feet bgs.
- Gravelly sand, generally present below the clay layer and continuing down to 40 feet bgs.
The soil conditions were described to be damp to moist, but not wet, indicating that groundwater was not encountered within any of the soil borings (up to 40 feet in depth).
In 2017, a series of 30 borings were advanced to a depth of 26 feet bgs within a 6×6 foot area surrounding the former HRW. Deposits encountered includes sand, silty, clayey sand and clay.
In 2021, a series of 28 shallow (5 to 10 feet bgs) soil borings were advanced to the east of the loading dock. Deposits encountered included loose soil, dense gray sandy clay and caliche, a very dense white to tan calcium carbonate deposit.
In 2024, six soil borings were drilled using the sonic drilling method to enable the collection of soil cores from the ground surface to a depth of 365 feet bgs and installation of six monitor wells on site. Soil samples were collected every 2 or 2.5 feet from the cores, providing highly detailed lithologic information. No indications of faulting were observed during drilling or subsequent analysis of the borehole information (DBS&A, 2025).
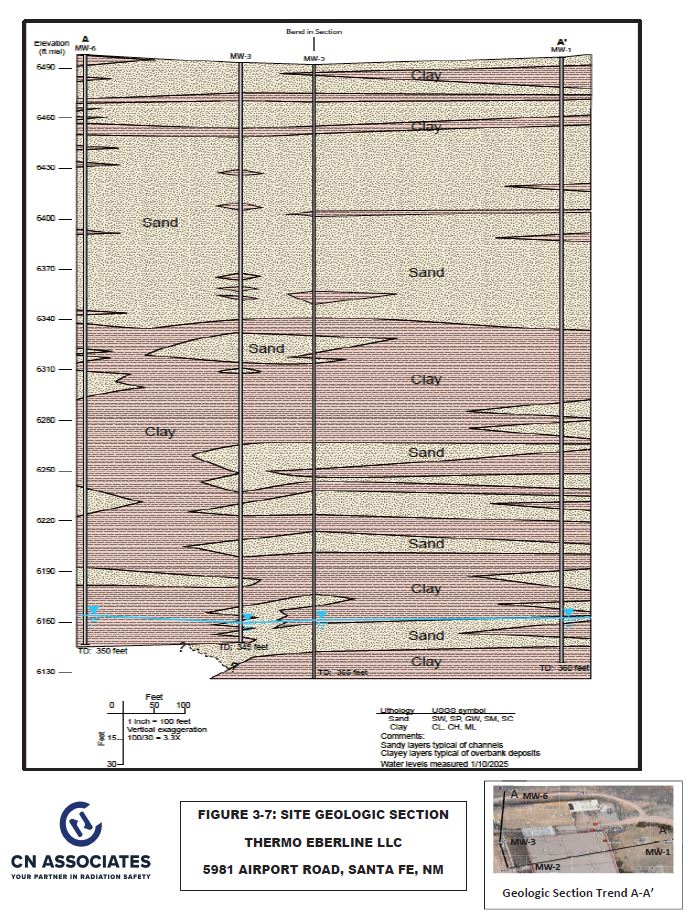
The lithology observed in drill cores matches the depositional environments typical of the Tesuque Formation, as expected (DBS&A, 2025). The alternating sand and clay layers were deposited in stream channels and floodplains of the ancestral Santa Fe River. In particular, the observed color and grain size of the core samples match descriptions of the Tesuque Formation for overbank deposits and associated tributary channels. An example cross section based on monitor wells MW-1 and MW-3 was constructed for the site (Figure 3-7). This section illustrates some important site-specific observations, including:
- The clay layer present at a depth of 24 feet in borings advanced in 2009 around the former calibration wells within the building was found to be continuous across the site.
- A second continuous clay layer was encountered at 40 feet bgs.
- A 90 to 100-foot sequence of clay-dominated sediments was encountered in each boring from about 135 to 225 feet bgs. These sediments include clayey sands, silty sand, and clay. These units match the descriptions of typical floodplain deposits in the Tesuque Formation.
- Near the water table at about 329 to 334 feet bgs, the lithology consists of interbedded sand and sandy clay units, interpreted to be tributary channel deposits that occur within overbank or floodplain deposits. The sands are fine- to coarse grained, brown and yellow colors with rounded grains. The clayey sands and clays are typical fine sand and clay and typically brown.
- An example of a brown sand occurs from 332 to 350 and 355 to 365 feet bgs in MW-2 and was observed in MW-1 and MW-3. The sand changes texture towards the north into clayey sands and sandy clays (e.g., MW-5) and towards the south the textures are silty and clayey sands (e.g., MW-4).
3.4.4 Regional Geologic Structures & Tectonics
The structural geologic features of the Santa Fe area are the result of relatively recent geologic activity, Tertiary and younger. As discussed above, Santa Fe is located near the eastern boundary of the Española Basin, which is one of a number of interconnected basins that make up the Rio Grande Depression. The development of the basins is the result of continental rifting that initially began 29 million years ago and continues today.
The rifting that followed the early Tertiary Laramide orogeny and created the Sangre de Cristo Range to the east, is described by some as a continuation of Laramide deformation (Chapin, 1979). The extensional forces which followed the compression of the Laramide created a series of uplifts and associated down-dropped fault blocks of significant elevation differences, as evidenced in the thickness of basin-fill sediments along the Rio Grande Rift Zone (Chapin, 1979).
Fault zones mark the structural boundaries of the Española Basin, including:
- To the east, north-south trending buried thrust faults along the Sangre de Cristo Range, suggesting that during basin formation Laramide and older faults may have been exploited.
- To the west, the Pajarito Fault Zone and possibly the Cañada de Cochiti Fault Zone further west, both north trending (Koning, et. al., 2007); and normal faults in the Embudo Fault Zone to the north.
The remaining significant structural features of the area also resulted from the regional rifting. Volcanism linked to faulting and crustal thinning within and adjacent to the rift zone in the Santa Fe area began around 14 million years ago. The resulting Jemez and Cerros del Rio volcanic fields bound the Española Basin on the west and southwest, respectively (Koning, et. al., 2007).
The closest mapped fault to the site is exposed in the Santa Fe River a little over one mile from the site (Koning and Read, 2010). The site is on the upthown side of this fault, which is part of the larger Agua Fria Fault System. Additional faults may exist near the site which could not be identified based on existing information.
3.4.5 Seismology
As would be expected considering the tectonic setting of the region (discussed above), New Mexico has an active seismic history. Researchers from the New Mexico Institute of Mining and Technology have developed catalogs of earthquakes for the state and bordering areas for the time frame of 1869 to 1998.
Figure 3-8 (from Sanford, et. al., 2002) illustrates the epicenters of earthquakes in the region having moment magnitudes of 3.0 or greater.
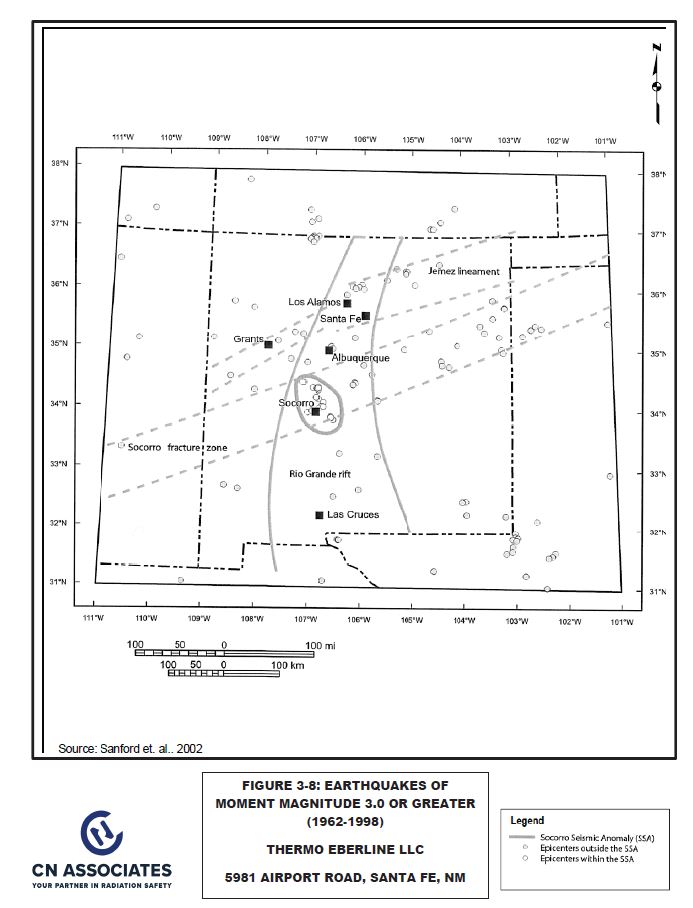
A total of 155 events are plotted for the time period of 1962 to 1998. Evident on Figure 3-8 is the concentration of events (36) in an area referred to as the Socorro Seismic Anomaly, approximately 140 miles south- southwest of Santa Fe.
Seismicity in that area is attributed to crustal thinning and the presence of an underlying large mass of magma (Sanford, et. al., 2002). Of note are a number of historic earthquakes along an identified fracture zone trending east-northeast in the area north of Santa Fe (possibly consistent with the Embudo Fault Zone that bounds the Española Basin to the north) and the absence of obvious seismic activity trending north-south with the Rio Grande Rift.
Regarding seismicity in the area more local to the site, Broxton and Vaniman (2004) report that the Pajarito Fault Zone that forms the western boundary of the Española Basin remains active. A strong earthquake occurred in 1918 approximately 25 miles southwest of Santa Fe. According to the USGS website, the modified Mercalli intensity of the event was VII – VIII with reports of a rupture of the earth’s surface and residents being thrown from their feet (USGS, 2009).
According to a USGS seismic hazard map produced in 2008, the site is situated in an area where a peak ground acceleration of 18 percent gravity has a two percent probability of exceedance in 50 years. The USGS references that 10 percent gravity “may be the threshold for damage to pre- 1965 structures.”
3.5 Surface Water Hydrology
Hydrology involves the study of water on the surface of the earth such as the occurrence, movement and use of rivers, streams and lakes. Surface waters are generally classified by basins that correspond to areas of topographic depression where precipitation and/or groundwater flow within the basin boundaries accumulates to form surface waters. The occurrence of groundwater is integral to the formation and persistence of surface waters. Many surface waters in the Española Basin are ephemeral, meaning they may last for only a short time during periods of flooding.
The critical nature of water resources in New Mexico resulted in the establishment of 16 planning regions in 1987, each charged with developing regional water use plans. The Española Basin became part of the Jemez y Sangre Water Planning Region, and the subject of the Jemez y Sangre Regional Water Plan (JySRWP) issued in 2003. The JySRWP assessed available supplies of surface water and groundwater, assessed current and future demand on water supplies and developed methods through conservation or acquisition to meet those demands (Stephens & Lewis, 2003).
The portion of the Española Basin containing the site is identified by the JySRWP as the Santa Fe River Sub-Basin which drains the Sangre de Cristo Range and covers an area of 284 square miles including the largest municipality, the City of Santa Fe (Land, 2016). The total elevation relief of the Santa Fe Sub-Basin is 6,900 feet extending from 12,150 feet msl in eastern mountains to 5,250 feet msl at the Rio Grande to the west. Annual precipitation in the Santa Fe Sub-Basin from 1868 to 1996 is reported at 12.5 inches average, 5.03 inches minimum and 21.75 inches maximum (Stephens & Lewis, 2003).
Surface waters in the area surrounding the site include (USGS, 2022):
- The Santa Fe River, approximately 0.75 miles north.
- An intermittent drainage approximately 0.4 miles south and southwest of the site that feeds the Arroyo de Los Chamisos.
- The Rio Grande is located approximately 16 miles west.
- Cochiti Reservoir is located on the Rio Grande approximately 16 miles to the west, which maintains a permanent pool of 50,000 acre-feet.
The Santa Fe River is the most significant surface water resource in the sub- basin. The river is perennial from Santa Fe Lake at 11,700 feet msl in the east to the Nichols Reservoir and from the city wastewater treatment plant (located southwest of Santa Fe) to Cochiti Lake. The Santa Fe River naturally discharges to the Rio Grande about two miles south of Cochiti Lake, but discharges have been diverted three miles upstream of the confluence (Stephens & Lewis, 2003).
The nearest surface water feature to the site for which flow data is available is the Santa Fe River. The river experiences intermittent flow primarily due to controlled discharges from the two reservoirs located seven and nine miles upstream of the site. Surface waters supply an estimated 47 percent of the City of Santa Fe’s public water, while public and private wells supply an estimated 53 percent (Stephens & Lewis, 2003) for a total demand of 15,000 acre-feet per year (AFY in 2003). Agricultural uses draw another 3,000 AFY from surface waters from the Santa Fe River. The demand in the Santa Fe Sub-Basin is estimated to double from 15,000 AFY in 2003 to 30,000 AFY in 2060 (Stephens & Lewis, 2003).
3.6 Groundwater Hydrology
Hydrogeology involves the study of water within subsurface geologic formations that is defined as groundwater.
3.6.1 Regional Groundwater Hydrology
Within the Española Basin, the Tesuque Formation is the most significant water-bearing formation and the primary aquifer (source of potable drinking water) for the City of Santa Fe (Lazarus and Drakos, 1995). Shallow groundwater has been detected at the top of the Tesuque and in the Ancha Formations to the south of Santa Fe.
Recharge to the Tesuque and Ancha occurs primarily via precipitation and streamflow infiltration along the Sangre de Cristo Mountain front to the east of the site. This recharge occurs at high elevations and provides the driving force for the regional direction of groundwater flow within the Española Basin from east to west where groundwater ultimately discharges to the Rio Grande (or its tributaries) or is intercepted by supply wells (Lewis and West, 1995; Lazarus and Drakos, 1995).
Figure 3-9 is excerpted from the New Mexico Bureau of Geology and Mineral Resources Open File Report 520 that illustrates regional groundwater flow patterns within the Española Basin (Johnson, 2009). The blue lines represent groundwater contours as points of equal groundwater elevation interpreted from groundwater level measurements in wells (plotted as singular elevation points). The pink lines are interpreted as groundwater flow paths with the direction of flow being perpendicular to the groundwater contours (blue lines). The rate of groundwater flow is generally greater, or faster, when the blue lines are closer together, and less, or slower, when the blue lines are further apart. The shading from light to dark blue indicates varying depths to groundwater. The very light blue patches indicate depths of groundwater less than 100 ft, while most areas of the basin are middle blue (greater than 100 ft) to darker blue (100 to greater than 500 ft).
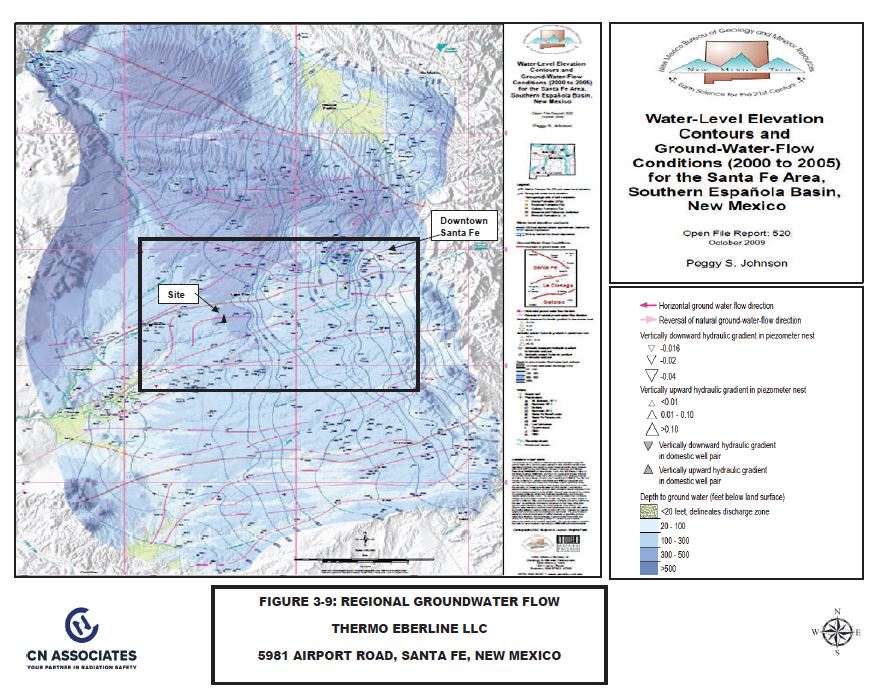
The regional flow pattern illustrated in Figure 3-9 is generally from east to west, consistent with recharge areas in the Sangre de Cristo Mountains (areas where precipitation infiltrates downward into the subsurface and replenishes groundwater). The Rio Grande is the primary receiving surface water (where groundwater flows upward and “daylights” to create a surface water body such as a river, stream, etc.). Also shown are the localized effects of pumping wells that supply the City of Santa Fe where the contours are circular and hashed on the inside indicating downward flow into a pumping well.
Figure 3-10 is a blowup excerpted from the area within the box in Figure 3- 9 to show mapped flow near the site at a larger scale. The darker blue shading around the site suggests a depth to groundwater at 300 to 500 ft. Using the two closest groundwater elevations plotted to the east and west of the site (6,154 ft msl and 6,155 ft msl), and the elevation of the site (6,497 ft msl), suggests that the depth to groundwater beneath the site is at 343 ft. The direction of groundwater flow based on regional data is interpreted to be due west based on the groundwater contours. The wide distance between the groundwater contours (blue lines) around the site indicate the rate of groundwater flow is relatively slow, or indicative of what is termed a “flat” gradient.
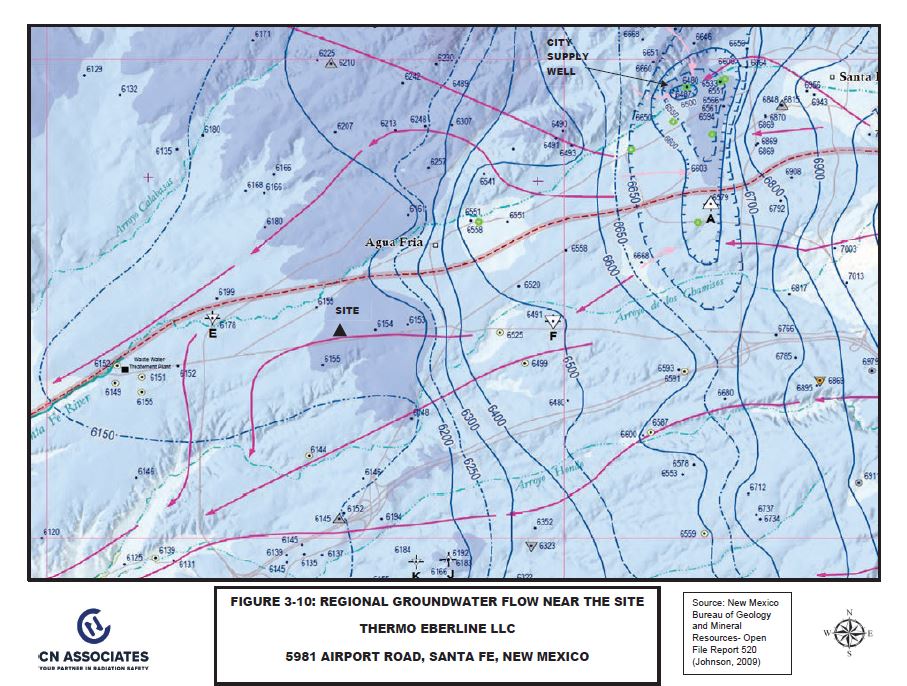
Other features of note in Figure 3-10 include: 1) the location of the Santa Fe River, an estimated 0.75 miles to the north of the site; and 2) the inferred boundary of a “groundwater unit” designated by the dashed/highlighted brown line to the north of the site. The boundary unit line is subparallel to the Santa Fe River and marks the boundary between the Santa Fe groundwater unit to the north and the La Cienega groundwater unit to the south. These groundwater units represent inferred boundaries between areas of groundwater flow and contribution.
The rate of groundwater flow in the Tesuque Formation (measured as hydraulic conductivity) is estimated to range from 0.2-6.0 feet/day in the Española Basin as a whole with an estimated rate on the lower end of the range of 0.7 feet/day in area of Santa Fe (Lazarus and Drakos, 1995).
3.6.2 Site Groundwater Hydrology
Site groundwater hydrology is interpreted based on a site groundwater evaluation completed in 2024 by Daniel B. Stephens & Associates, Inc. (DBS&A) in coordination with CN. That evaluation included the installation of six monitor wells (MW-1 through MW-6) to evaluate site groundwater quality and groundwater flow. Results of that evaluation are summarized in DBS&A’s report entitled, “Monitor Well Installation & Groundwater Monitoring Report.” Salient findings from DBS&A’s report describing site hydrogeology are summarized below (DBS&A, 2025).
Groundwater beneath the site is found at a depth of 329 to 334 feet within the Tesuque Formation. The movement of groundwater in the Tesuque Formation is influenced by sediment grain-size and sorting, and the extent and shape of the geologic units in the aquifer (Koning and others, 2007).
The six monitoring wells MW-1 through MW-6 installed at the site are screened in sand units that are often interbedded with clayey sands.
These sand units appear to be above a consistently occurring clay unit that may limit the hydraulic connectivity between groundwater in the sand units adjacent to the well screens and sand units that occur deeper in the Tesuque Formation aquifer.
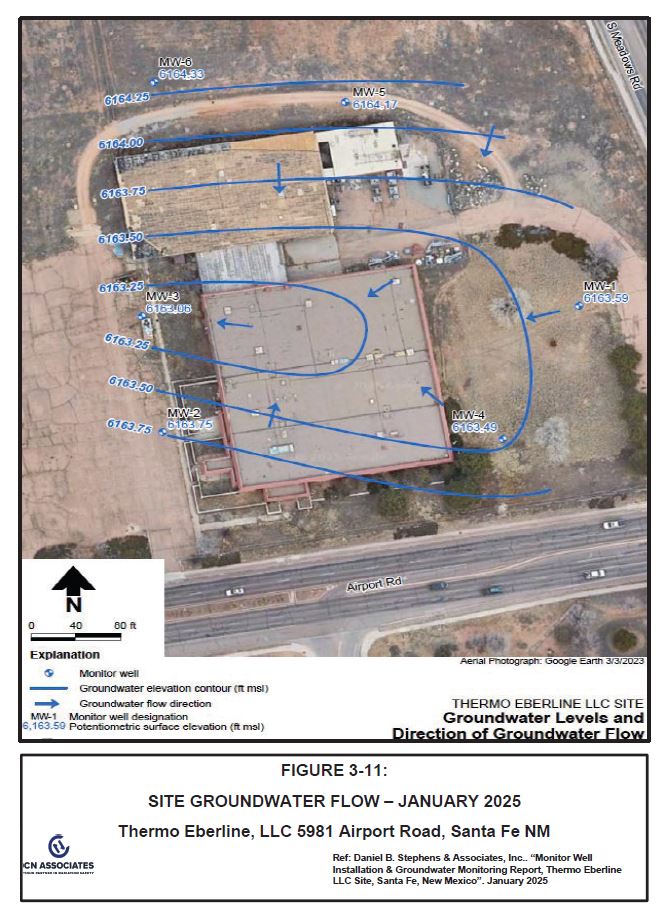
Observed water levels and the interpreted water-table surface as measured on January 10, 2025 are provided in Figure 3-11. The hydraulic gradient (slope of the water table) indicated by the contours in Figure 3-11 ranges from about 0.002 to 0.005 foot per foot, which is typical for the Tesuque Formation. The direction of groundwater flow beneath the site is shown to funnel toward well MW-3. The funneling of groundwater toward well MW-3 is interpreted to reflect the location of that well within more permeable channel-sand deposits of higher hydraulic conductivity as opposed to the other five wells completed in less permeable overbank deposits of lower hydraulic conductivity.
3.7 Natural Resources
There are no significant natural resources occurring at or near the site. There are no known economic, marginally economic or subeconomic natural resources at or surrounding the site as defined in USGS Circular 831 (USGS, 1980).
There are no mineral, fuel or hydrocarbon resources near or surrounding the site which, if exploited, would affect the Licensee’s dose estimates.